High-spatial-resolution mapping and source apportionment of aerosol composition in Oakland, California, using mobile aerosol mass spectrometry
Recommended citation: Shah, R.U., Robinson, E.S., Gu, P., Robinson, A.L., Apte, J.S. and Presto, A.A., 2018. High-spatial-resolution mapping and source apportionment of aerosol composition in Oakland, California, using mobile aerosol mass spectrometry. *Atmospheric Chemistry and Physics*, 18(22), pp.16325-16344.
Psst! Scroll down for some behind the scenes content!
Abstract
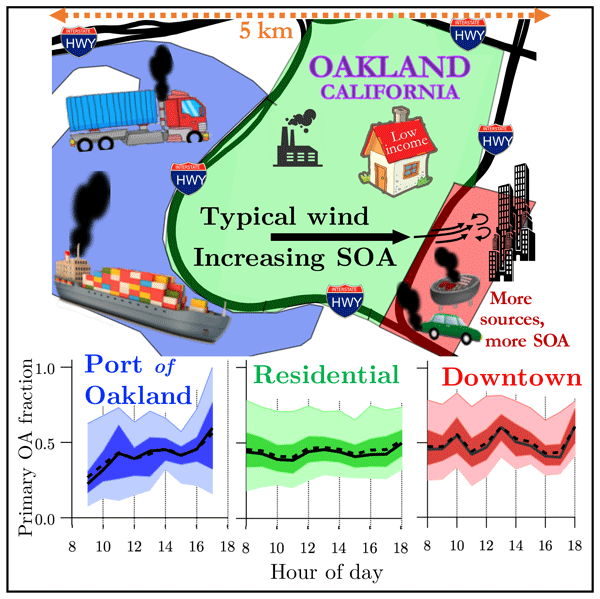
We investigated spatial and temporal patterns in the concentration and composition of submicron particulate matter (PM1) in Oakland, California, in the summer of 2017 using an aerosol mass spectrometer mounted in a mobile laboratory. We performed ∼160 h of mobile sampling in the city over a 20-day period. Measurements are compared for three adjacent neighborhoods with distinct land uses: a central business district (“downtown”), a residential district (“West Oakland”), and a major shipping port (“port”). The average organic aerosol (OA) concentration is 5.3 μg m-3 and contributes ∼50 % of the PM1 mass. OA concentrations in downtown are, on average, 1.5 μg m-3 higher than in West Oakland and port. We decomposed OA into three factors using positive matrix factorization: hydrocarbon-like OA (HOA; 20% average contribution), cooking OA (COA; 25%), and less-oxidized oxygenated OA (LO-OOA; 55%). The collective 45% contribution from primary OA (HOA + COA) emphasizes the importance of primary emissions in Oakland. The dominant source of primary OA shifts from HOA-rich in the morning to COA-rich after lunchtime. COA in downtown is consistently higher than West Oakland and port due to a large number of restaurants. HOA exhibits variability in space and time. The morning-time HOA concentration in downtown is twice that in port, but port HOA increases more than two-fold during midday, likely because trucking activity at the port peaks at that time. While it is challenging to mathematically apportion traffic-emitted OA between drayage trucks and cars, combining measurements of OA with black carbon and CO suggests that while trucks have an important effect on OA and BC at the port, gasoline-engine cars are the dominant source of traffic emissions in the rest of Oakland. Despite the expectation of being spatially uniform, LO-OOA also exhibits spatial differences. Morning-time LO-OOA in downtown is roughly 25% (∼0.6 μg m-3) higher than the rest of Oakland. Even as the entire domain approaches a more uniform photochemical state in the afternoon, downtown LO-OOA remains statistically higher than West Oakland and port, suggesting that downtown is a microenvironment with higher photochemical activity. Higher concentrations of particulate sulfate (also of secondary origin) with no direct sources in Oakland further reflect higher photochemical activity in downtown. A combination of several factors (poor ventilation of air masses in street canyons, higher concentrations of precursor gases, higher concentrations of the hydroxyl radical) likely results in the proposed high photochemical activity in downtown. Lastly, through Van Krevelen analysis of the elemental ratios (H∕C, O∕C) of the OA, we show that OA in Oakland is more chemically reduced than several other urban areas. This underscores the importance of primary emissions in Oakland. We also show that mixing of oceanic air masses with these primary emissions in Oakland is an important processing mechanism that governs the overall OA composition in Oakland.
Behind the scenes
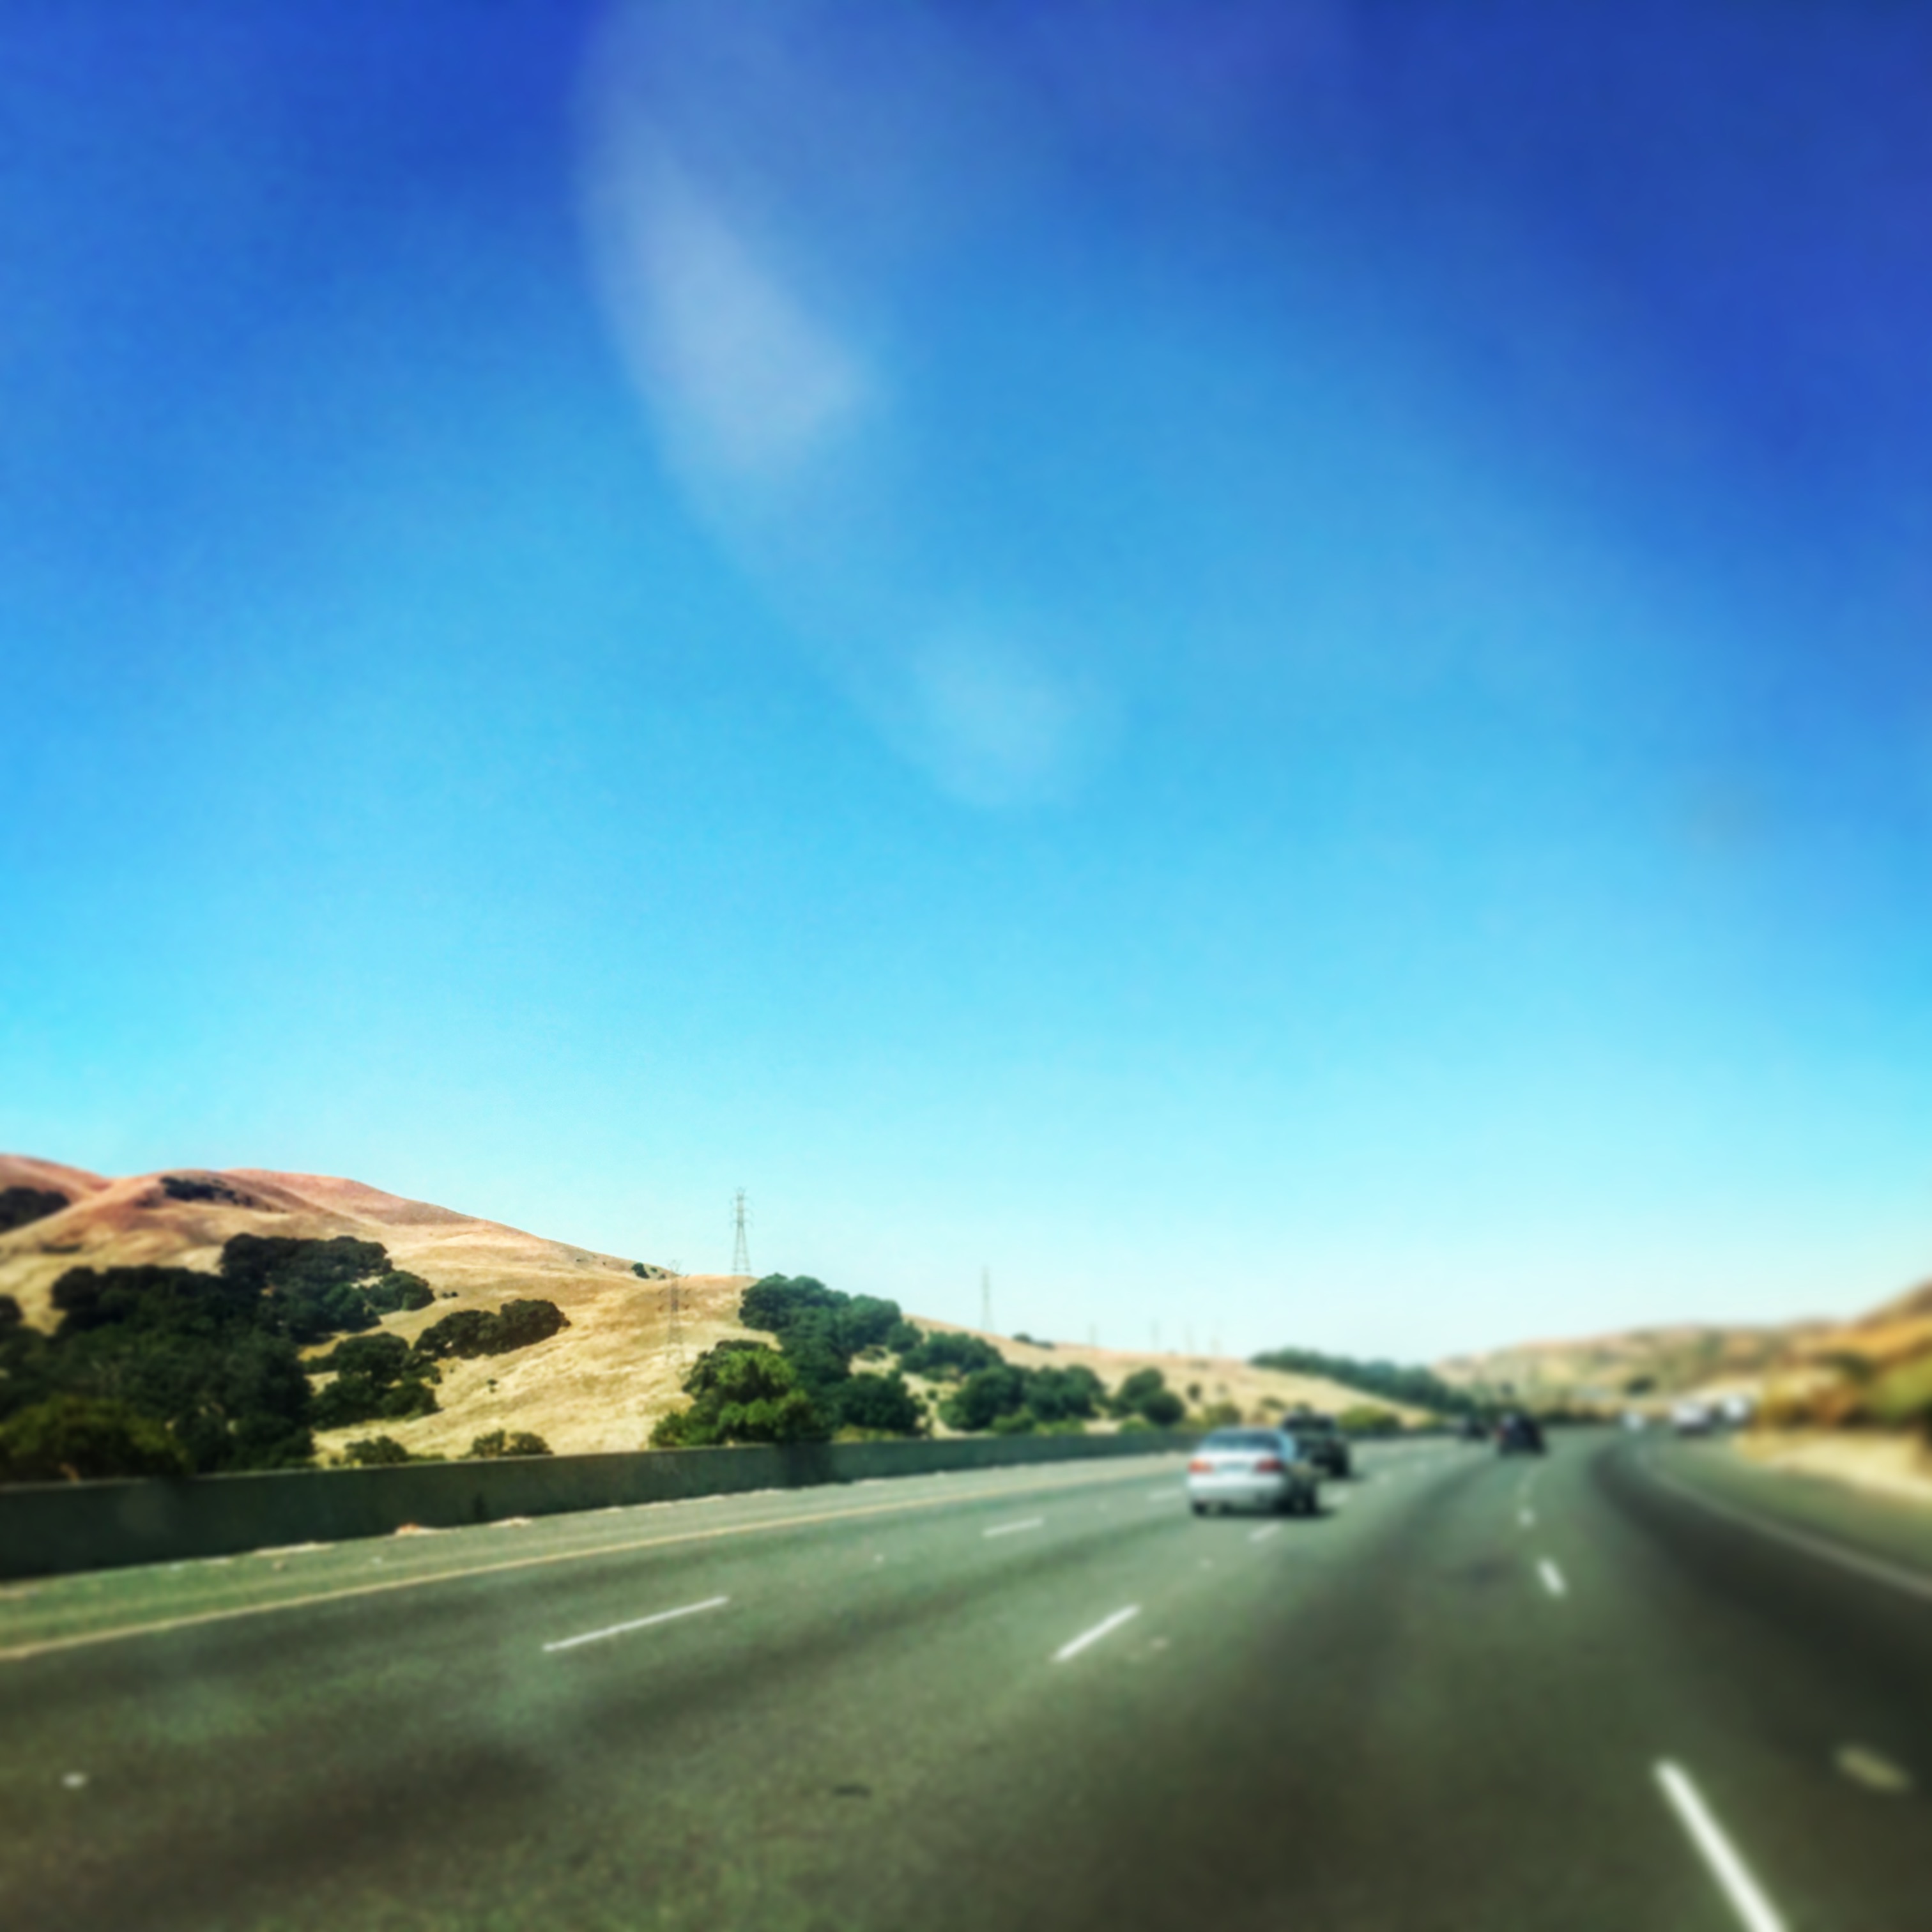
Yes, we drove our instrumented van from Pittsburgh, PA to Berkeley, CA. And yes, it was beautiful, especially once we were west of Kansas (some pictures below).
Though the paper says that the measurement campaign began on 10th July 2017, it was originally supposed to begin on 24th June 2017. However, upon arrival in Berkeley, we discovered that our instrument was not working. We ended up spending 2 weeks trying to fix the instrument. This involved taking apart the instrument again and again, ruling out one potential source of malfunction after the next. Every day was the same drill: open a part of the instrument, visually inspect the complex circuitry, take lots of pictures, put it back together. And all this while also exchanging emails and phone calls with the instrument manufacturer, desperate shouts for help in the Berkeley area, even a trip up to Davis, CA, in the hopes of getting diagnostic help from researchers at UC Davis. Finally, it turned out to be a bad electric connection in a high-voltage unit of the instrument. Here’s a picture of me preparing a soldering station to fix this connection at our AirBnB. 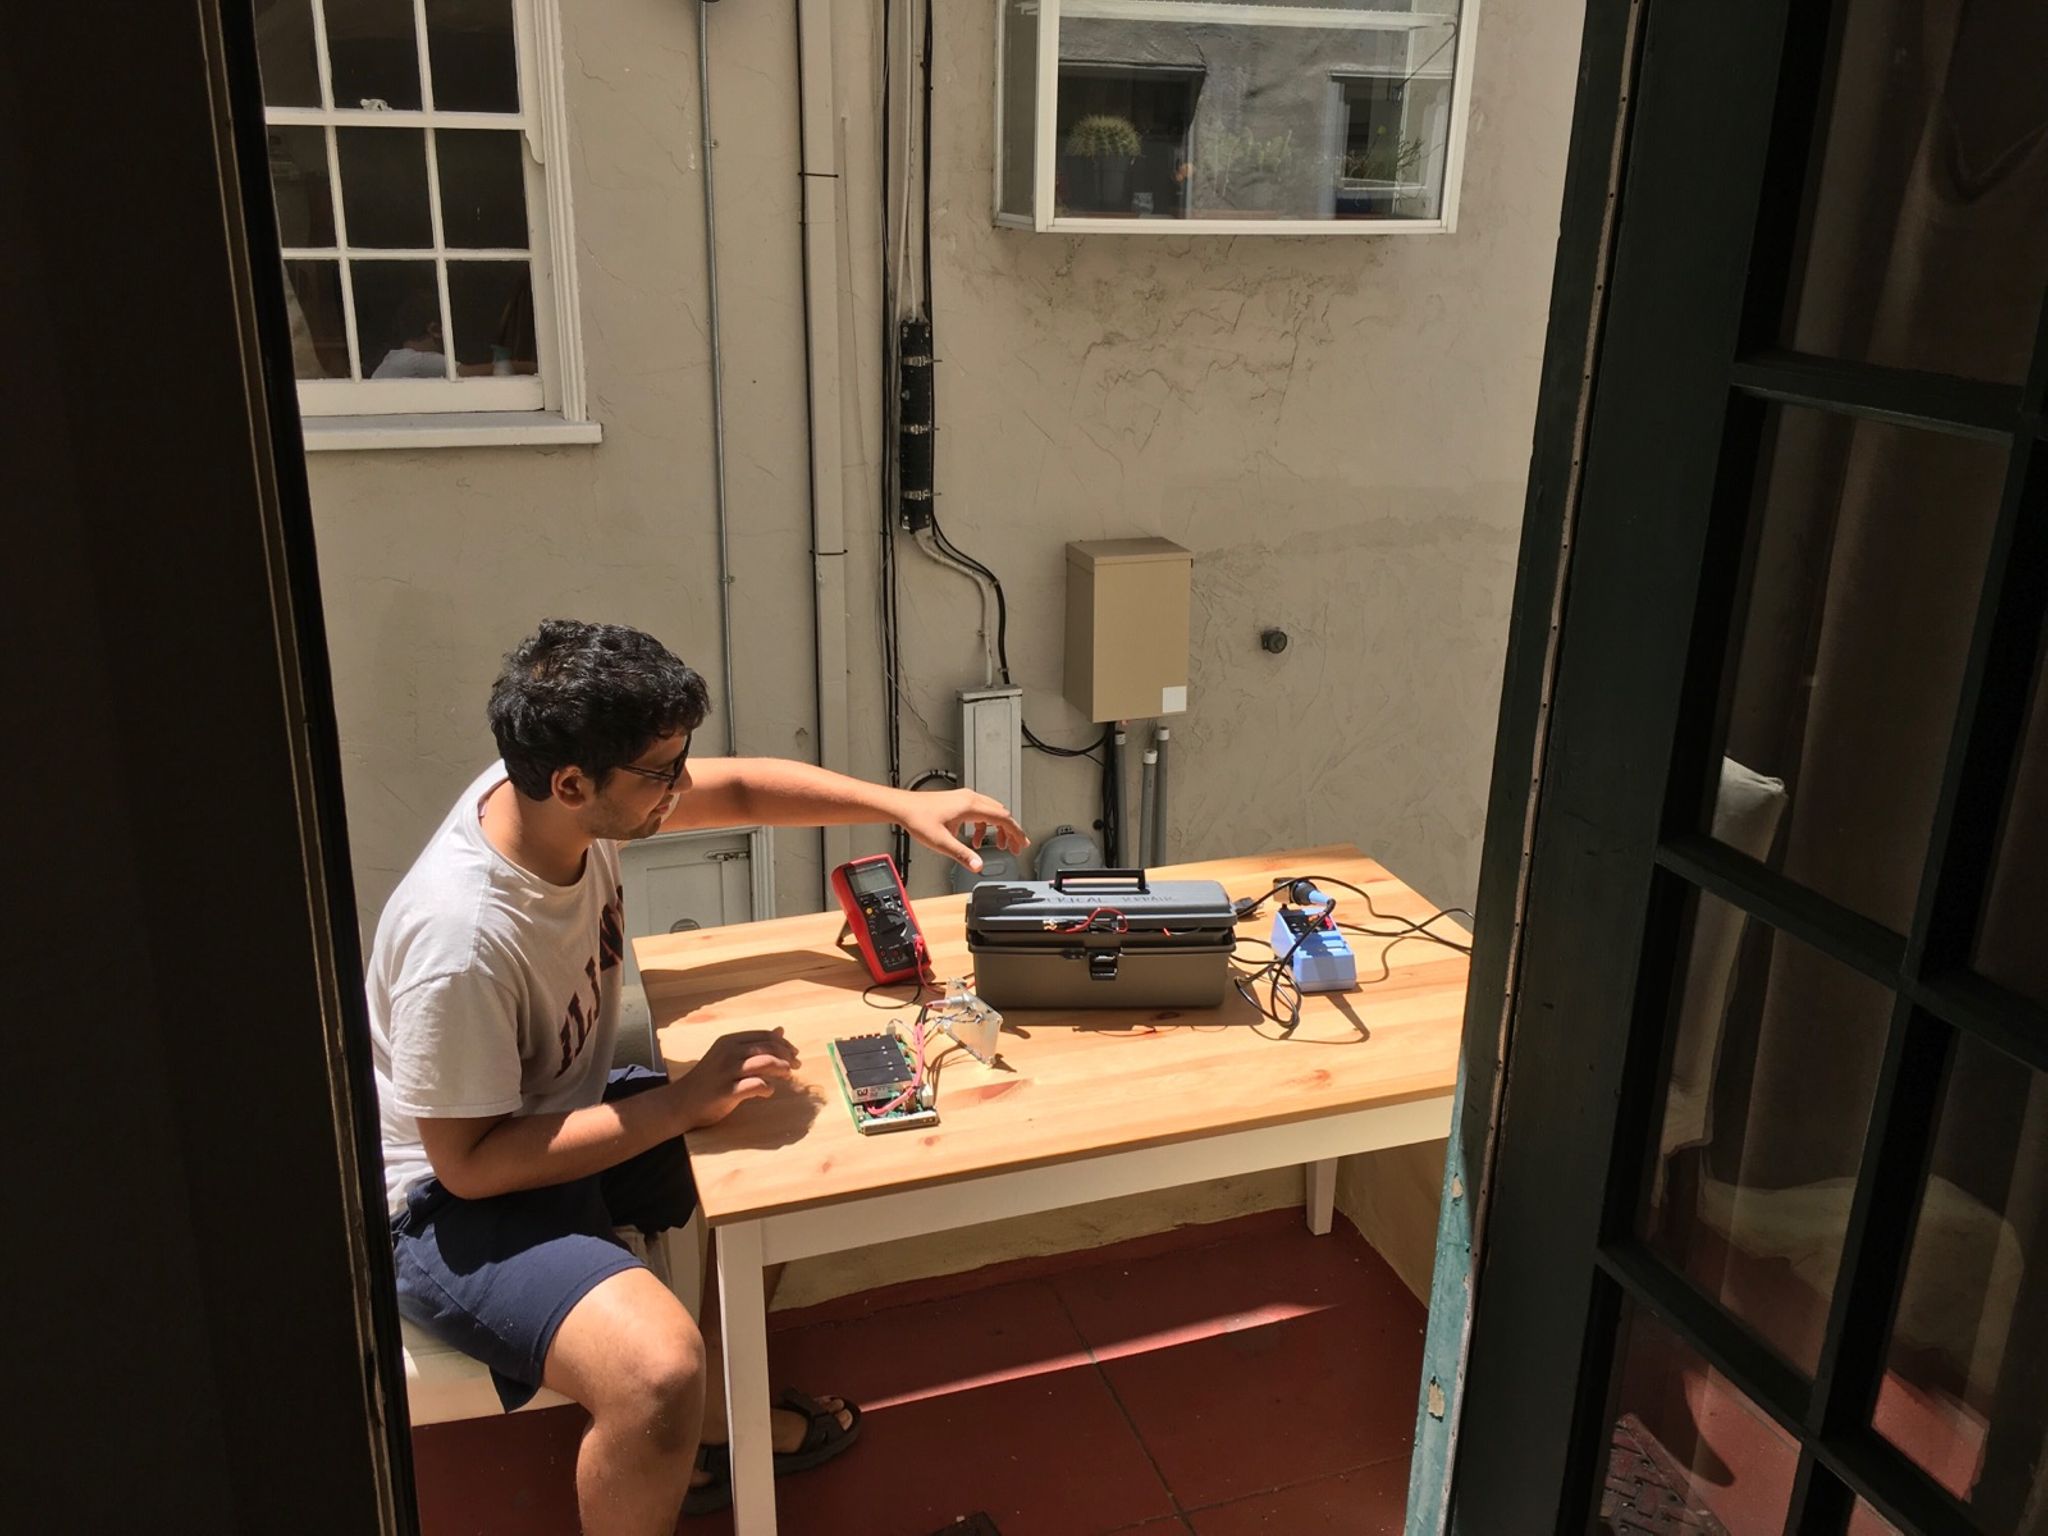
And now, here are some pictures of the road trip:
Colorado
Wyoming
Utah
Nevada
California